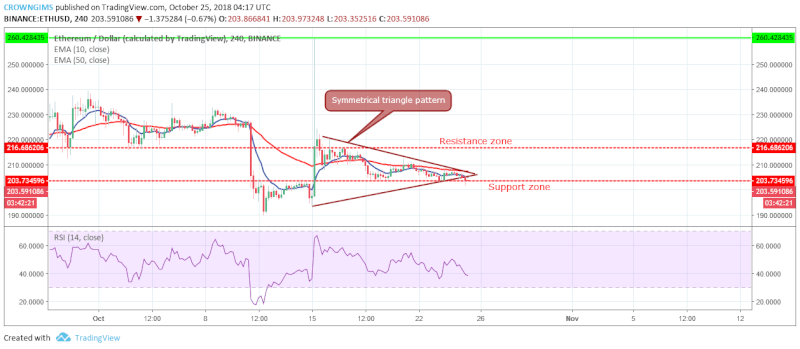
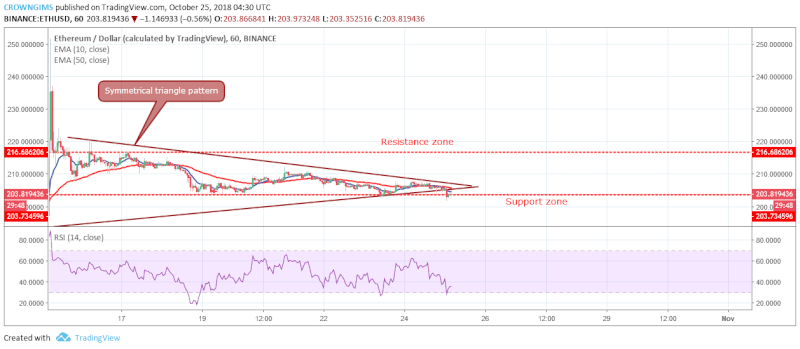
Resistance and support zones for ETH :
Resistance zones: $216, $223, $232
Support zones: $203, $196, $189
ETH Price Analysis for Medium-term: Bearish

ETE was ranging yesterday in the medium-term outlook. As predicted yesterday ETH broke out of the symmetrical triangle at the lower trend line of the triangle. The coin is heading down to the support zone of $196 and it is advisable to take a short trade.
ETH’s price is below 10-day EMA and 50-day EMA, which indicates an ongoing fall in the price of ETH. However, the RSI 14 is below 40 levels and its signal lines point toward the south, indicating a sell signal.
A breakout from the symmetrical triangle pattern is already seen; this breakdown at the lower support area is a selling opportunity. Therefore, traders can go short.
ETH Price Analysis for Short-term: Bearish

resistance zone of $216 and the support zone of $203. The coin has broken out from the symmetrical triangle from the lower trend line of the triangle. This is a selling period for ETH.
ETH is below the 10-day EMA and the 50-day EMA, which indicates a sell signal. Nevertheless, the RSI 14 is above 20 levels with signal lines points to the north indicating a buy signal.

