


Supply zones: $1.03, $1.11, $1.21
Demand zones: $0.99, $0.96, $0.84
WAN/USD Medium-term Trend: Bullish
WAN/USD broke out of the ranging channel two days ago. It broke upward the strong supply zone of $0.96 and $0.99 by the bullish pressure confirmed by the formation of massive bullish candles. The price was pushed upward above the supply zone of $0.99.The coin has been exposed to the higher supply zone of $1.11. The upward movement of the WAN was interrupted at the supply zone of $1.1 by the sellers’ pressure in order to retest the demand zone of $0.99.
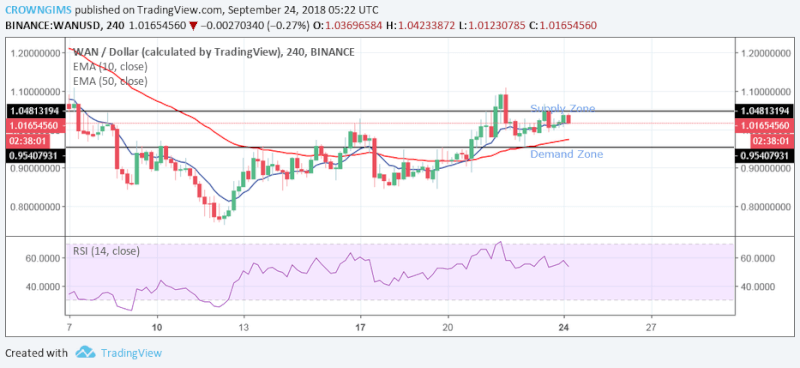
Currently, the coin is above the demand level of $0.99. The downward movement of the coin towards the demand zone of $0.96 is possible. In case the bulls lose its momentum and the Bears’ pressure increases, there is a possibility for the price to break down at the demand zone of $0.99.
The price is below the 10-day EMA and 50-day EMA suggesting the bearish movement of the price. The MACD with its histogram is below zero levels and its signal lines point downward, thus signaling a downward movement.
WAN/USD Short-term Trend: Bullish
Formation of massive bullish candles on short-term which indicates the bulls’ pressure made the price to break the resistance level of $0.96 and $0.99 upward. The price was rejected at the supply zone of $1.01, retested the demand zone of $0.99 zone and followed by some weak bearish candles. WAN is bearish in the short-term outlook.
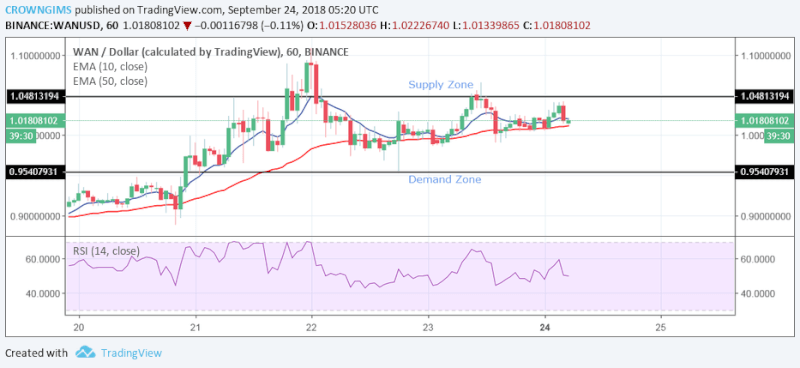
As at present, the Price is toward the demand zone of $0.99.The price is below 10-day EMA and 50-day EMA with the MACD below zero regions with signal lines Pointing downward which indicates sell signal. Taking a short position today may give some green pips.