


Tron (TRX) supply and demand zones:
Supply zones: $0.026, $0.028, $0.30
Demand zones: $0.024, $0.022, $0.020
Tron (TRX) Medium-term Price Analysis: Bearish
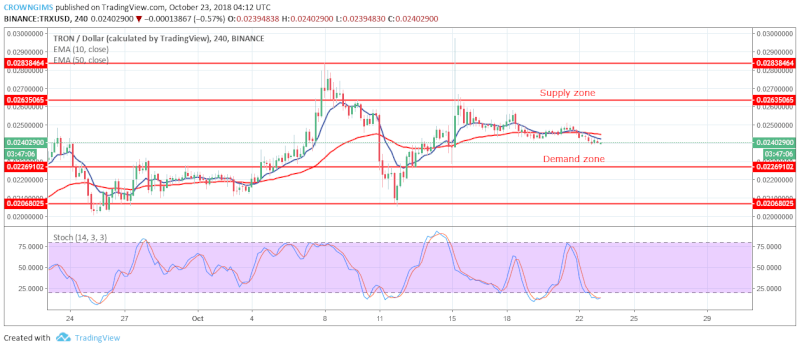
Tron is bearish on its 4-Hour chart. The coin consolidated on the 4-Hour chart yesterday. When the coin reached the demand zone of $0.024, the coin entered a consolidation phase.
Continuation of the bears’ momentum has made the coin move toward the demand zone of $0.024. Considering that the demand zone of $0.024 is broken; it will bring the coin to its low at the demand zone of $0.022. In case this low demand zone holds and the price bounces back, the pair will find its high in the supply zone of $0.026 and $0.028. The stochastic oscillator 14 is below 20 levels (oversold level) and its signal lines point to the south indicating a sell signal.
Tron (TRX) Short-term Price Analysis: Bearish
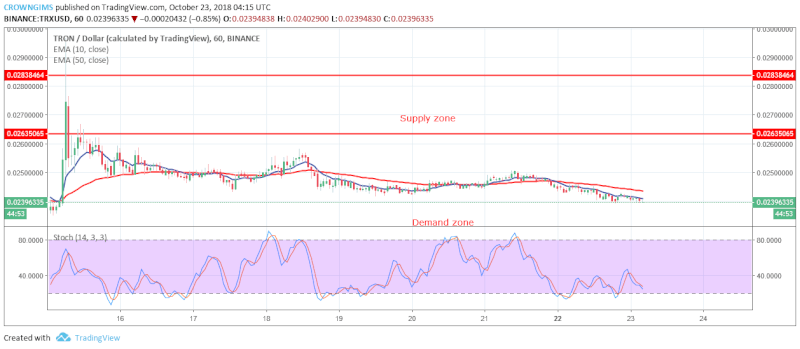
TRX is in its bearish movement on the 1-Hour chart and the cryptocurrency pair is bearish. The bears are pushing the coin towards the demand zone of $0.024. In case the bears increase their momentum, the coin may be pushed to break the demand zone of $0.024 and expose TRX to the demand zone of $0.022.
The price of TRX is below the 10-day EMA and 50-day EMA which indicates that the price is falling. The stochastic Oscillator 14 is above 25 levels with signal lines pointing toward the south which indicates a sell signal.
![]()