


Resistance levels: $0.041, $0.045, $0.049
Support levels: $0.037, $0.034, $0.032
ZIL/USD Medium-term Trend: Bullish
Yesterday, ZIL/USD was able to break out the upper resistance level of $0.041 with the formation of strong bullish candles and the price rallied to the north above the resistance level of $0.045. It was exposed to the upper resistance level of $0.048. The uptrend movement of the price was rejected immediately after the price broke out from the resistance level of $0.045 by the bears; this was confirmed by the formation of a strong upper long tail bearish candle. The price of the coin fell as price approaches the support level of $0.032. The bulls took over the control of the market as strong bullish candles were formed.
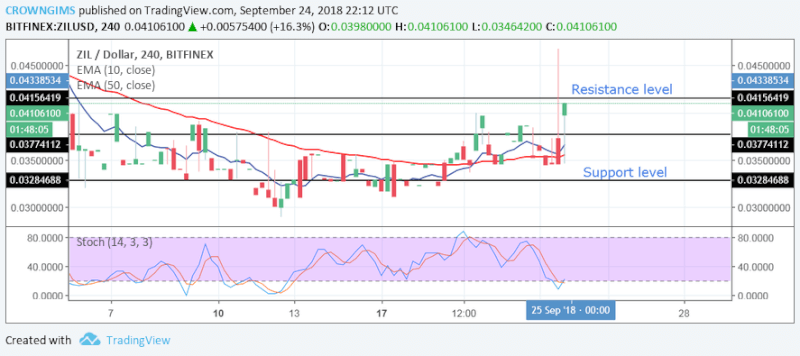
In case the price falls to the support level of $0.032 and it does not hold, the price will be exposed to the stronger support level of $0.029. Nevertheless, the Stochastic Oscillator period 14 is below 20 levels (the oversold level) with its signal lines pointing upwards indicate a buy signal. The price of ZIL is far above the 10-day EMA and the 50-day EMA suggesting uptrend movement. Should the support level of $0.037 holds the price will rally to the north.
ZIL/USD Short-term Trend: Bullish
The coin was able to break the resistance level of $0.041 upward yesterday. ZIL/USD formed strong bullish candles on the short-term trend that broke the resistance up to a higher price level of $0.045. ZIL/USD is bullish in its short-term trend. The price was rejected back below the support level of $0.037 by the Bears’ pressure. As at present the price is moving upward towards the resistance level of $0.041 with the pressure from the buyers. The price is above the
10-day EMA and the 50-day EMA, which indicates upward movement.
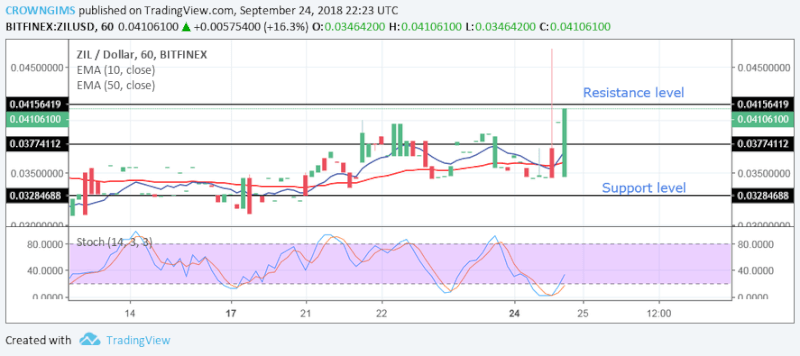
The Stochastic Oscillator period 14 is below 20 levels with the signal lines pointing towards north which indicates that the price may move upward. There is a probability for the price to increase tremendously today.
![]()