


Cardano (ADA) Distribution and accumulation territories:
Distribution territories: $0.075, $0.080, $0.085
Accumulation territories: $0.073, $0.072, $0.069
Cardano Medium-term Price Analysis: Bearish
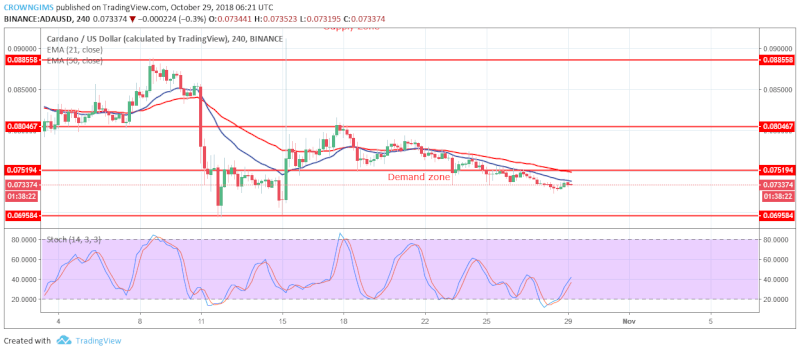
ADA is in a bearish trend. This was clearly shown on the 4-Hour chart when a strong bearish candle broke downside the two EMAs that serve as a strong support on October 21st and the bullish pressure from the formation of an inverted hammer formation was weakened at $0.078 in the distribution territory. Rejection to upward continuation occurred at the downward trend.
The bears are in control of the market as more bearish candles are forming and ADA’s price is falling and it has broken downside the former accumulation territory of $0.075. The 21-day EMA has crossed the 50-day EMA downside, which indicates downtrend movement. More bearish candles are forming below the two EMAs and the two EMAs are fanned apart. This implies more sellers were present in the market with high strength in the context of the trend. Stochastic oscillator is at 40 levels with its signal lines pointing to the north, which indicates an upward movement that serves as a price retracement in the downtrend market before the continuation of its downtrend movement.
Cardano Short-term Price Analysis: Bearish
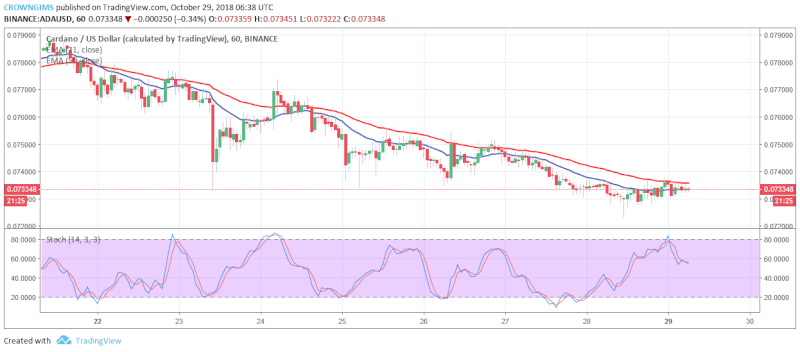
ADA is in its bearish trend on the 1-Hour chart. The bears increased its momentum and ADA’s price was pushed down south breaking the former accumulation territory of $0.075 and moving towards accumulation territory of $0.073.
ADA’s price is below 10-day EMA and the 50-day EMA as the downtrend indication. In addition, stochastic oscillator is above 50 levels with signal lines pointing to the south which indicates a sell signal.
![]()