


Resistance and support zones for ETH :
Resistance zones: $216, $222, $231
Support zones: $208, $195, $190
ETH Price Analysis for Medium-term: Bearish
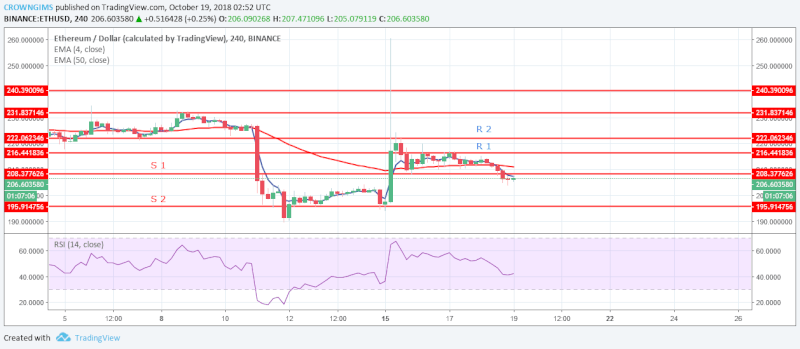
ETH is bearish in its medium-term outlook. Before the bearish trend, ETH had been range bound between the resistance zone of $216 and the support zone of $208 for more than two days. It was at this range bound zone that the price pulled back to the lower level and broke the lower range of $208. Today, the cryptocurrency is fluctuating below the lower level of the price range at support zone of $208.
ETH has broken the support level of $208, then, it will find its low at the support levels of $195 and $190. In case the bulls defend this zones and the price bounces back, traders should initiate long trades and stop-loss order below the support zone of $190, traders can exit the long trade when price reverses or at the resistance zone of$216.
It is below the 4-day EMA and 50-day EMA with the two EMAs separated from each other, which indicates that the price is falling. However, the RSI 14 is above 40 levels and its signal lines point to the north indicates a buy signal.
ETH Price Analysis for Short-term: Bearish
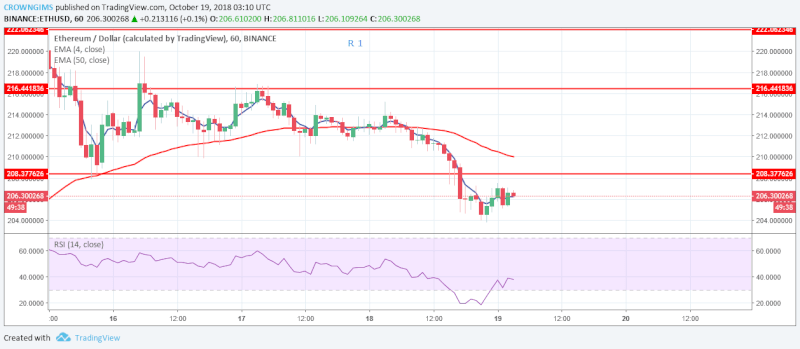
The cryptocurrency is also in its bearish trend on the 1-Hour chart. The coin broke out from the consolidation bound range. It pulled back below the lower range of the bound at the support zone of $208.
The market is below 4-day EMA and 50-day EMA. The RSI 14 is on the 40 level with signal lines points to the north indicates the bulls may take control of the market.
![]()