


Resistance and support zones for Ethereum:
Resistance zones: $222, $234, $242
Support zones: $213, $203, $195
Ethereum Price Analysis for Medium-term: Bullish
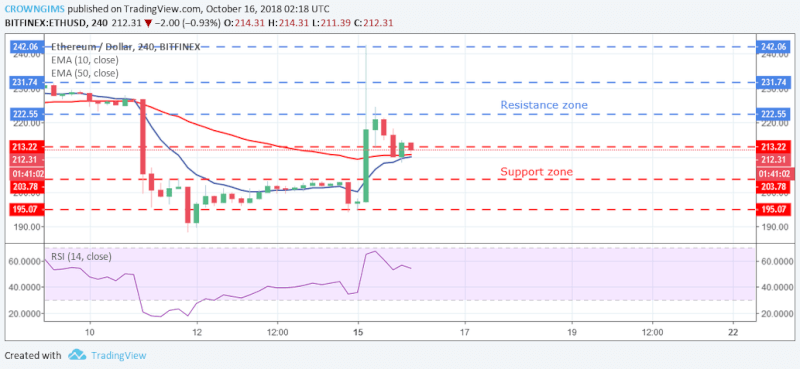
ETH is bullish in its medium-term. The bulls took over the market and the price increased rapidly yesterday. The coin was increased to the resistance level of $242 and the market pushed down to the support zone of $213 by the increased momentum of the bears.
The coin moved the market down further when the bulls did not have much pressure and the bears were trying to push the price to the south. The coin may continue its uptrend movement to the next resistance zone of $222, only if the bulls increase their momentum.
ETH is above the 10-day EMA and 50-day EMA with the RSI 14 above 50 levels and its signal lines point to the south, which indicates sell signal.
Ethereum Price Analysis for Short-term: Bearish
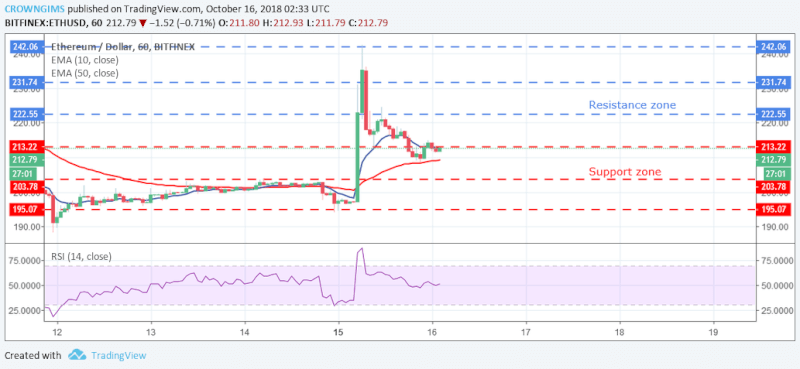
ETH is bearish in its short-term. The coin made a rapid and sudden uptrend movement towards the resistance zone of $242, after which it was rejected by the bears. The formation of long upper wick candles, indicate the rejection of uptrend movement by the bears. This was followed by the formation of more bearish candles. which led the market to the support zone of $213.
Further, the increase of bears will expose the coin to the support zone of $203. The market is in-between the10-day EMA and 50-day EMA with the RSI on 50 level with signal lines pointing upward which a suggest buy signal.
![]()