


The past week has led to stagnation across the cryptocurrency market for the most part, with a majority of assets moving minutely in either direction. However, there has been a range of exceptions from this across the top 100, with assets such as XRP and LTC beginning to accelerate in price, while others such as SNX and DOT have substantially shed value. As of the 26th of March, the cryptocurrency market cap stands at $1.16T, a decrease of $200 million from the week prior, but an increase of 1.53% in the past 24 hours.
Bitcoin (BTC)
Opening the week at $27.97k, Bitcoin was subject to vast volatility across the past week, which has volleyed it from the upper boundaries of $26k to the middle region of $28k. On the 19th, BTC immediately plunged beneath its 7-day SMA, before beginning to recuperate some value and pushing itself back above this threshold. This trend ensued until the 21st, when BTC price pushed itself to a weekly high of $28,716 before it sharply fell to a weekly low of $26,760 in the space of four hours. Following this, BTC remained well below its 7-day SMA until the 23rd, where it then spiked but was quickly submerged by the 7-day SMA threshold. As a result, BTC closed the week at around $27.7k.
Having resumed the vicious volatile price trajectory, BTC appears to be facing adversity at the $27.8k region, with this appearing to act as a new resistance zone. As a result, it appears as if the lower $27k region has become the new average trading price. In total, BTC fell by 0.62% this week.
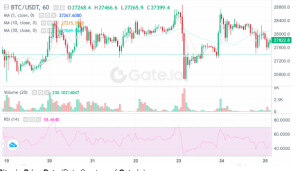
Bitcoin Price Data (Data Courtesy of Gate.io)
Synthetix (SNX)
Following last week’s liquidity injection as a result of DWF Labs acquiring $15M worth of Synthetix, SNX began a downward trading trajectory as it entered the week. Starting the week at $2.89, SNX price briefly pushed above $3 and reached a weekly high of $3.1853 before it began to decline progressively through the upper $2.9 region. On the 20th, SNX finally dipped beneath its 7-day SMA but tried holding its ground by pushing up once again, before it fell below the threshold for good. In the following days, SNX fell further into the mid to lower $2 region and eventually closed the week near its weekly low of $2.3809.
Having deviated from the recent uptick in value, SNX appears to be forming a gradual downward trend that is likely to be realized in the coming week, potentially pushing it toward its monthly low of $2.0372. In total, Ethereum fell by 15.59% this past week.
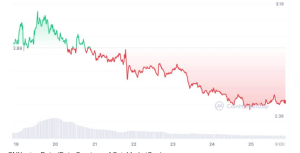
SNX price Data (Data Courtesy of CoinMarketCap)
XRP (XRP)
Entering the week at $0.39, XRP endured a positive week, whereby its penchant for volatility played in its favor as it cruised well above its 7-day SMA and pushed it toward the target zone of $0.50. Throughout the 19th and half of of the 20th, XRP was pushed below its 7-day SMA, before it sharply rose to a weekly high of $0.4906. From this high, XRP fell to between $0.425 and $0.44 and remained relatively consistent at this level in the middle of the week, despite spikes in value. As a result, XRP price closed the week at $0.445.
With this immense volatility, XRP will likely continue to experience this in the coming months, which can be linked to the upcoming SEC vs Ripple lawsuit verdict, which has resulted in a mixed sentiment throughout the XRP community and wider cryptocurrency communities. However, with this volatility beginning to play in XRP’s favor, it is possible that this momentum could extend into the coming week and push it further toward $0.45. Across the past week, XRP increased by 13.91%.
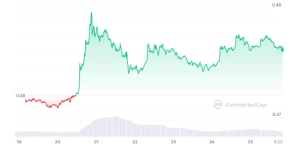
XRP price Data (Data Courtesy of CoinMarketCap)
Polkadot (DOT)
Across the past week, Polkadot has suffered a decimating decline as a result of the past month’s volatile trend. Starting the week at $6.48, DOT sharply fell below its 7-day SMA and failed to near the level for the remainder of the week. DOT quickly began to descend through the $6 region throughout the 20th and 21st, before showing potential signs of recovery, where it pushed toward $6.4, yet, this was quickly disrupted by further price declines throughout the remainder of the week. DOT price reached a weekly low of $5.863 and closed the week at around $6.
Having continued the recent bearish trend, DOT appears to be delving further into a bearish spiral and is potentially pushing toward its monthly low once again. In the coming week, it is plausible that DOT will continue along this trading trajectory and push deeper into the $5 zone. Across the past week, DOT fell by 7.46%.
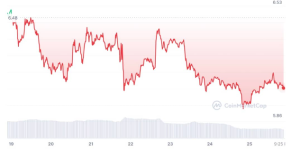
DOT price Data (Data Courtesy of CoinMarketCap)
Litecoin (LTC)
Across the past week, LTC has endured a progressive upward incline. Starting the week at $84.7, LTC fell through its 7-day SMA and bottomed at $78.1 on the 20th. However, on the 22nd, LTC began to gain some momentum and was privy to a sharp uptick in value that propelled it through the $80 region and led it to continue increasing in value at a relatively consistent pace until it reached a weekly high of $95.33 on the 23rd. LTC then began to trade horizontally between $90 and $94, which led it to close the week at $92.85.
With the recent volatile downtrend appearing to have been disrupted, it appears as if LTC is pushing toward the $95 zone, and that provided it can maintain its current bullish price momentum, it could realize this in the coming week. Across the past week, LTC price has increased by 7.55%.
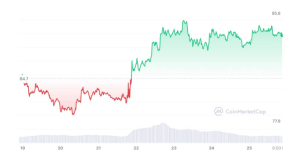
LTC price Data (Data Courtesy of CoinMarketCap)
![]()