


Resistance levels: $0.035, $0.041, $0.045
Support levels: $0.032, $0.030, $0.028
ZIL/USD Medium-term Trend: Ranging
ZIL/USD is still trading within the bound range of resistance level of $0.035 and support level of $0.032. The coin started ranging shortly after the upper resistance level of $0.041 was broken, with the formation of strong bullish candles which made the price to move to the higher resistance level of $0.045.The bears interrupted the uptrend movement of the price, which was confirmed by the formation of a strong upper long tail bearish candle. The price of the coin fell as price approaches the support level of $0.032. The Bears took control of the market as strong bearish candles were formed. The coin is ranging in its medium-term outlook.
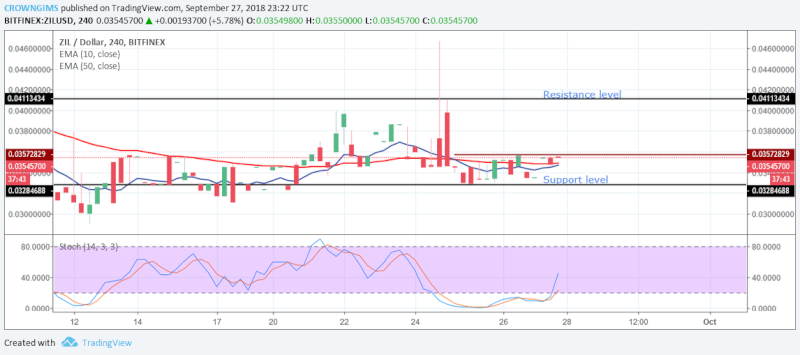
The price is still within the range on the support level of $0.032 consolidating. In case the support level of $0.032 does not hold, the price will continue its bearish movement and expose to the lower support level of $0.029.
The price of ZIL is above the 50-day EMA and the 10-day EMA suggesting uptrend movement. Should the support level of $0.032 holds the price will rally to the north. The Stochastic Oscillator period 14 is below 20 levels (the oversold level) with its signal lines pointing to the north indicate buy signal.
ZIL/USD Short-term Trend: Ranging
ZIL/USD has no enough bullish momentum to break the minor resistance level of $0.05 on the short-term outlook. The coin continues its ranging movement within the channel. It resumed its ranging mode shortly after the price was rejected from the resistance of $0.041 down to the support level of $0.032 by the Bears’ pressure. As at present the price is consolidating within the resistance level of $0.035 and support level of $0.032. The price is above the 500-day EMA and the 10-day EMA, which indicates upward movement.
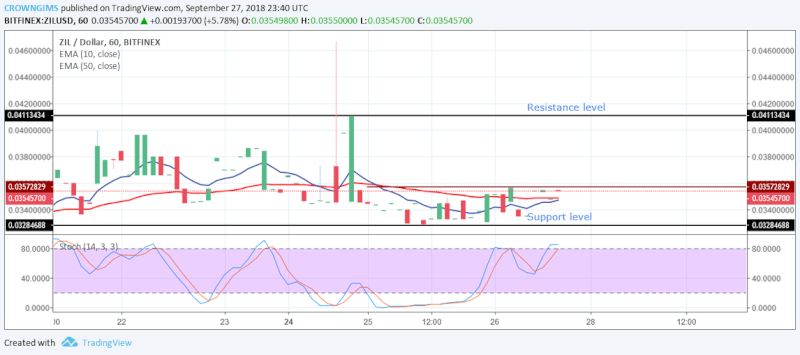
The Stochastic Oscillator period 14 is below 80 levels with the signal lines pointing upward which indicates that the price may increase. There is a probability for the price to break the resistance level of $0.035 in case the bulls increase their momentum.
![]()