


Resistance levels: $0.035, $0.038, $0.041
Support levels: $0.032, $0.029, $0.021
ZIL/USD Medium-term Trend: Bearish
ZIL/USD continues bearish in the medium-term outlook. It has been fallen for many days. The price couldn’t break out the resistance level of $0.035 when more sellers came in and push the price down towards the support level of $0.032. Further bearish pressure broke the support level of $0.032, pushed the price to the support level of $0.029 yesterday. The retracement was done by the price and resumed its downward movement with the formation bearish hammer candle.
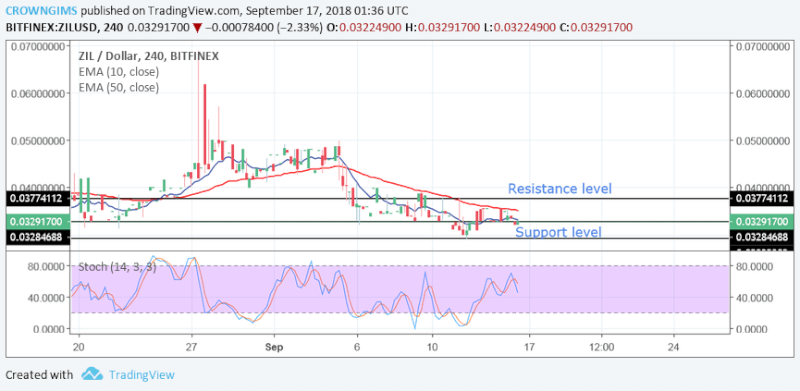
Currently, the price of ZIL/USD is at a price of $0.032 which is at the support. The Stochastic Oscillator period 14 is above 50 levels with its signal lines pointing downwards indicate a sell signal. In addition, the price of ZIL is below the 10-day EMA and the 50-day EMA together with the formation of bearish inside bar candle at the support level of $0.032 indicates that the price may go bearish. Nevertheless, a clear breakout and close above the resistance level of $0.035 would expose the coin to $0.038. Taking a short position may be logical.
ZIL/USD Short-term Trend: Bearish
The price moved down towards the support level of $0.029 and was rejected by the formation of strong bullish candles towards the resistance level of $0.038. On the 1-hour chart, the price of ZIL/USD is the support level of $0.032. The 10-day EMA is under the 50-day EMA and the price is below 10-day EMA which indicates bearish movement.
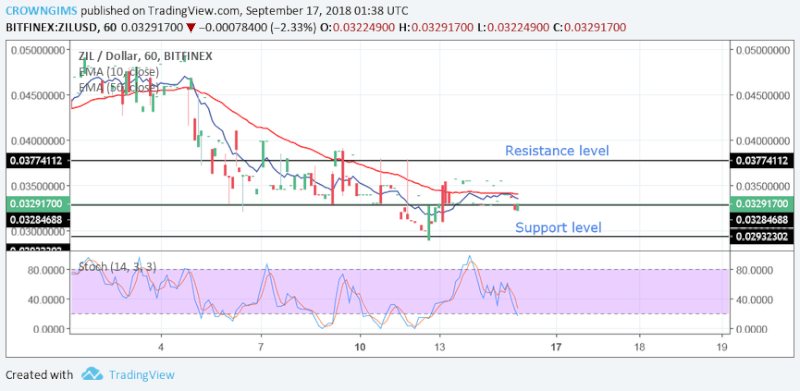
Should the price break the support level of $0.032, there would be further decreases in price towards $0.029. The Stochastic Oscillator period 14 is above 20 with the signal lines well separated and pointing towards south which indicates that the price is in the bearish trend. Traders should follow the trend patiently.
![]()