


Supply zones: $0.95, $1.04, $1.11
Demand zones: $0.84, $0.80, $0.76
WAN/USD Medium-term Trend: Bearish
WAN could not break upward the supply zone of $1.03, and the bullish pressure was lost confirmed by the formation of bearish candles. The price was pushed down to the demand zone of $0.99.The price broke out of the demand zone of $0.96 to the south as speculated yesterday and currently moving towards the lower demand zone of $0.84. The coin is above the demand level of $0.84. There is a probability for the coin to move upward towards the supply zone of $0.95. In case the bears lose its momentum and the Bulls increase its pressure, the supply level of $0.95 may be broken to the upside and the price resume its uptrend movement.
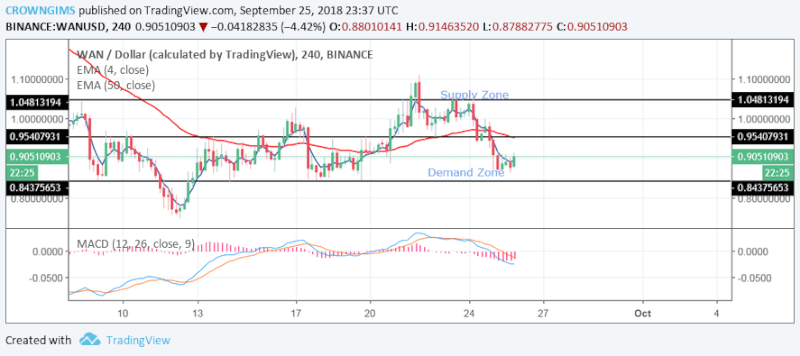
The price is below the 10-day EMA and 50-day EMA the price suggesting the bearish movement of the price as the MACD with its histogram is below zero levels and its signal lines bending towards the north, thus signaling an upward price reversal movement.
WAN/USD Short-term Trend: Bearish
WAN on the short-term is bearish with the aid of bearish candles formed yesterday at the supply zone of $1.04 which indicates the force of the bears into the market; the price was rejected at the supply zone and moved to the south towards the support zone of $0.95.
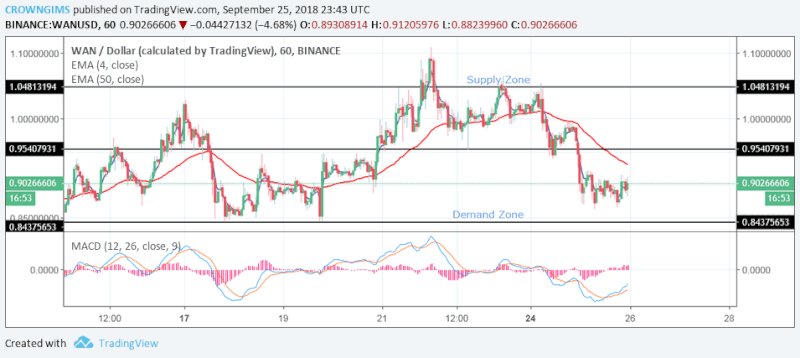
As at present, the Price has broken the demand zone of $0.96 downside and the price has been exposed to the lower demand zone of $0.84.The price is on the 10-day EMA and 50-day EMA is above the price with the MACD signal lines Pointing upward which indicates buy signal.
Read More: The Crypto Updates
![]()