


Supply zones: $0.96, $0.99, $1.04
Demand zones: $0.84, $0.75, $0.64
WAN/USD Medium-term Trend: Bullish
WAN was able to push the price upward above the supply zone of $0.96.The coin was ranging yesterday. Ranging started immediately after the downward movement of the WAN/USD was interrupted at the demand zone of $0.84. The bullish force which was clearly shown by the formation of a strong bullish candle broke the resistance of $0.96.
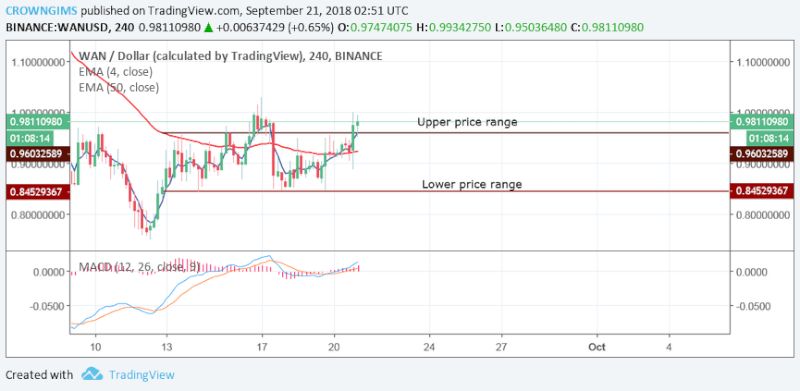
The 10-day EMA has crossed the 50-day EMA upward. The price is above the 10-day EMA and 50-day EMA suggesting the bullish movement of the price. The MACD with its histogram is above zero levels and its signal lines point upward, thus signaling an upward movement.
WAN is currently above the resistance level of $0.96. The 4-hour opening candle formed today at the supply zone of $0.96 was a Doji candle which connotes indecision. An uptrend movement of the coin towards the upper supply zone of $0.99 is possible. In case the bulls lose its momentum and the Bears' pressure increases, there is a possibility for the price to break down at the supply zone. It is therefore advisable for the traders to clearly wait for the formation of the bullish engulfing candle on the 1Hour chart before taking a long position.
WAN/USD Short-term Trend: Bullish
The bulls increase their force shortly after the rejection of the price at the demand zone of $0.84 yesterday. Formation of massive bullish candles on short-term which indicates the bulls’ force made the price to break the resistance level of $0.96 upward. The price broke the supply zone of $0.96, retested the zone and followed by a strong bullish engulfing candle which indicates a buy signal.
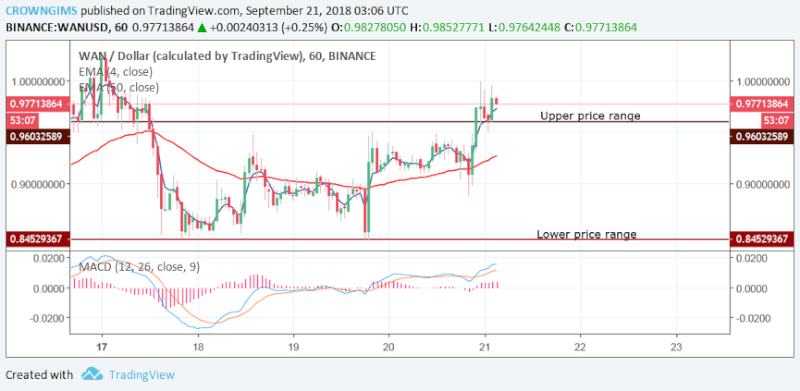
WAN is bullish in the short-term outlook. Currently, the Price is toward the supply zone of $0.99.The price is above 10-day EMA and 50- day EMA with the MACD above zero regions with signal lines Pointing upward which indicates buy signal. Taking a long position today may give green pips.
![]()