


Distribution territories: $0.011, $0.012, $0.016
Accumulation territories: $0.0099, $0.008, $0.007
HOT/USD Medium-term Trend: Bearish
Immediately after the increase of Hot towards the distribution territory of $0.012, the bears came into the market with force and the price was decreased below the distribution territory of $0.011.The increase in price was due to bulls’ pressure and the coin broke the distribution territory of $0.011 and the upper distribution territory of $0.012.

Bears increased their pressure, pushed the price down to the accumulation territories of $0.0099 but rejected at the territory, confirmed by the lower long wick candle. Buyers lost the momentum and the sellers took over the control of the market. The price moved downwardly but not to the reach of lower accumulation territory of $0.0099. Today On the 4H chart, the opening candle is bullish which suggests bullish price reversal.
The 10-day EMA has bent upward to the direction of 50-day EMA, the price is on the 10-day EMA and 50-day EMA above them. The RSI 14 is on 40 levels and its signal lines point upward, which indicates an upward movement. The price may go up today should buyers increases momentum.
HOT/USD Short-term Trend: Bearish
On the short term, Hot is bearish. The bears increased their momentum while bulls lost the momentum towards the distribution level of $0.012 and the price was pushed back below distribution territory of $0.011 by the formation of long upper tail bearish candles.
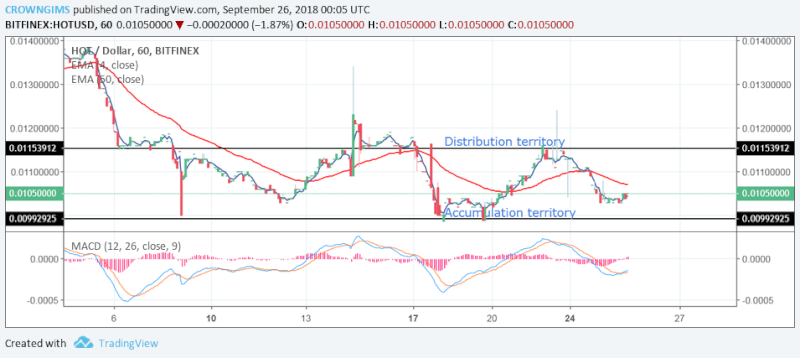
HOT started bearish trend immediately after the decrease in price yesterday on the short-term; which led to the movement of the price below the 10-day EMA and the 50-day EMA. The RSI 14 is above 40 levels with its signal lines pointing towards the north, which indicates the possibility of upward movement. Should the bulls increase their pressure the distribution zone of $0.011 may be broken. Taking short may be illogical today.
Read More: The Crypto Updates
![]()