


Tron (TRX) supply and demand zones:
Supply zones: $0.026, $0.028, $0.30
Demand zones: $0.025, $0.022, $0.020
Tron (TRX) Medium-term Price Analysis: Bearish
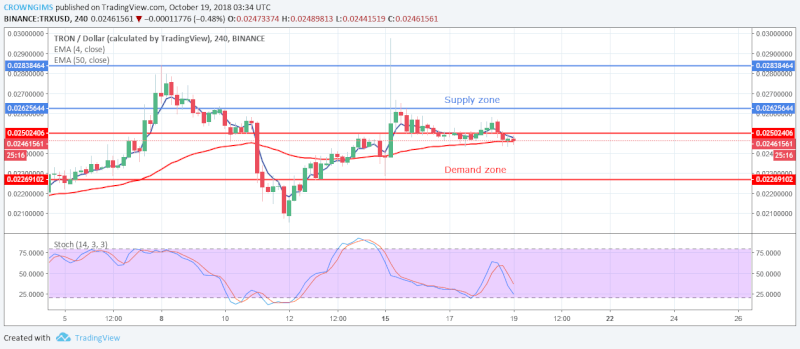
TRX is in a bearish trend. The cryptocurrency was consolidating on the 4-Hour chart yesterday at demand zone of $0.025. The bears pushed the pair below the demand zone of $0.025. Continuation of the bears’ momentum will bring the coin to its low at the demand zone of $0.022. In case this low demand zone holds and the price bounces back the pair will find its high in the supply zone of $0.026 and $0.028.
TRX is in-between the 4-day EMA and 50-day EMA, with EMA 10-day about to cross 50-day EMA downside indicating the price is falling. The stochastic oscillator 14 is below 50 levels and its signal lines points to the south indicate sell signal.
Tron (TRX) Short-term Price Analysis: Bearish
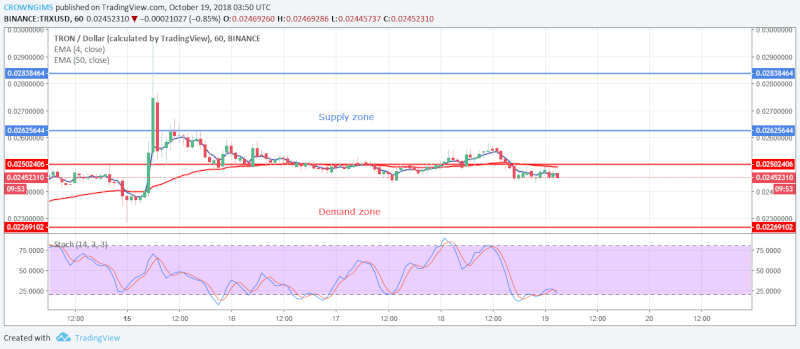
On 1-Hour chart the cryptocurrency pair is bearish. The bears pushed the coin out of the consolidation area by breaking the demand zone of $0.025 to the south. In case the bears increase their momentum, the coin may be pushed down to the demand zone of $0.022.
The price of TRX is below the 4-day EMA and 50-day EMA which indicates that the price is falling. The stochastic Oscillator 14 is above the 25 regions with signal lines pointing toward the south which indicates a sell signal.