


Tron (TRX) supply and demand zones:
Supply zones: $0.0243, $0.0251, $0.0259
Demand zones: $0.0232, $0.0213, $0.0191
Tron (TRX) Medium-term Price Analysis: Bearish
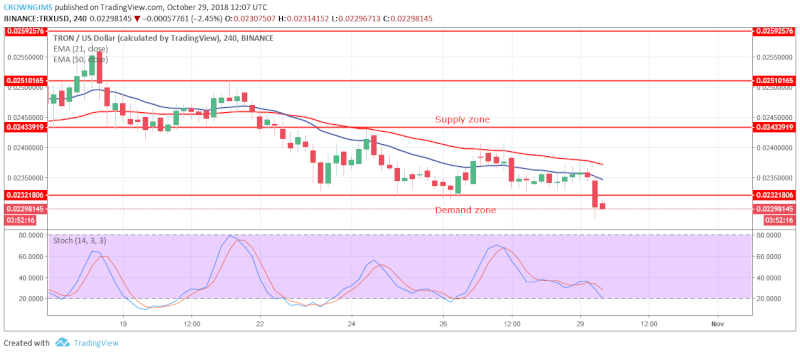
TRX continues in a bearish trend in its medium-term outlook. After crossing of the 21-day EMA over 50-day EMA downside, the coin broke down at the exponential moving averages on 22nd October. The bearish pressure has been on a movement to the south forming lower lows. $0.023 was low on 27th October and today TRX broke down the demand zone of $0.023. These are the characteristics of a down trending market that produces lower highs and lower lows.
With TRX/USD price below the 21-day and 50-day EMA couple with the stochastic oscillator period 14 at 30 levels which is the bear’s zone with its signal lines pointing down. These suggest downward movement in the cryptocurrency due to the bear’s pressure. The bear’s target may be the demand zone of $0.021.
Tron (TRX) Short-term Price Analysis: Bearish
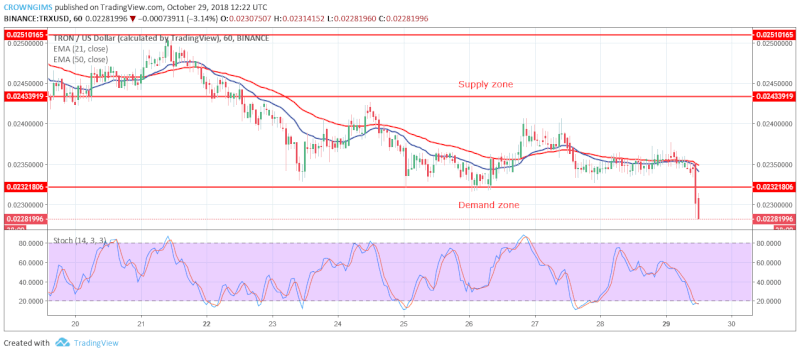
TRX is bearish in the short-term outlook. The market was in sideways movement yesterday. It is making a downward movement towards the demand zone of $0.021 and broke out downside with the formation of massive bearish candles. The price broke the yesterday’s demand zone of $0.023.
Currently, the price is below the demand zone of $0.0232 with the probability of moving further down to reach the lower demand zone of $0.0213, in case it is not interrupted by the bulls’ momentum. However, the stochastic period 14 is below the 20 regions with signal lines pointing toward the south indicating a sell signal.
![]()